Exploring Results
Custom Filter
Search results may also be selectively reduced through the use of custom filters, such as the previously described Paper Filter. To create a new filter, select “Add a filter +” on the filter bar to open the add filter form:
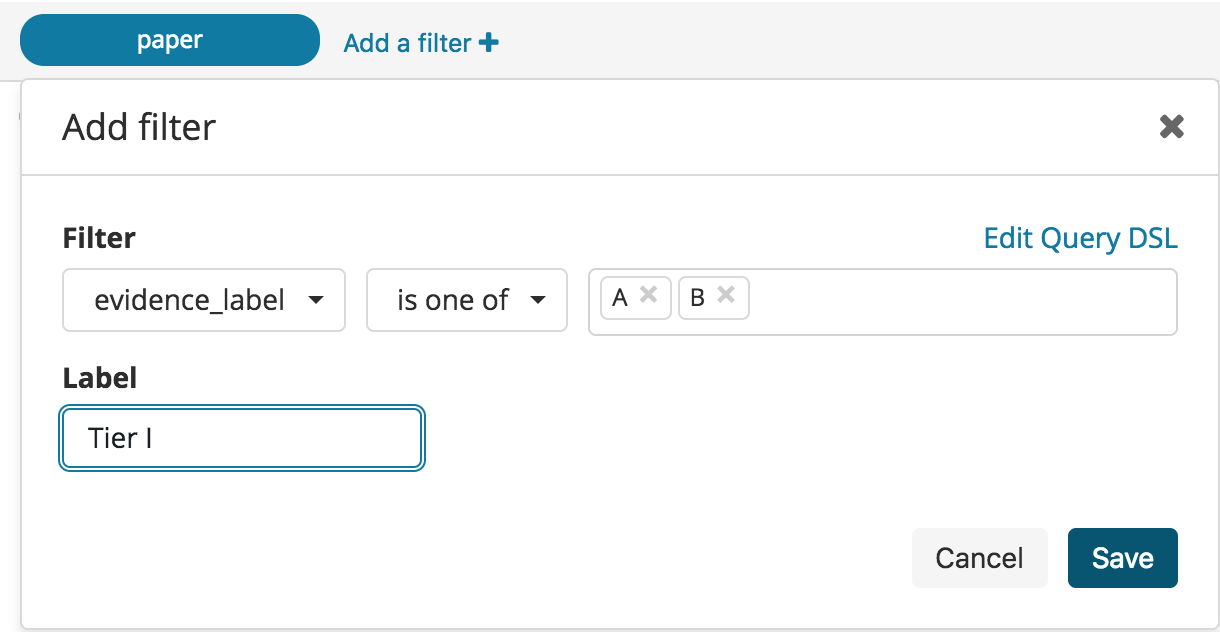
After selecting Save, the above will create a filter for AMP/ASCO/CAP Tier I (evidence label A, B) interpretations by selecting the evidence_label field and designating a set of values (A, B) that the field must match. We now have this additional filter available to be enable or disabled as needed during the review of search results by selecting the Disable/Enable filter button on the filter:

Filters can also be negated, such that they exclude results matching the filter criteria, which can be achieved by selecting the Exclude matches button on the filter:

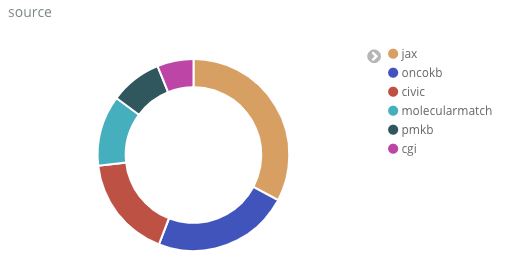
Source Pie
This interactive pie chart illustrates the distribution of results across the constituent sources of the meta-knowledgebase. Clicking on a segment of the pie chart will automatically create a Custom Filter for the selected element. This filter may be manually edited to include additional sources.
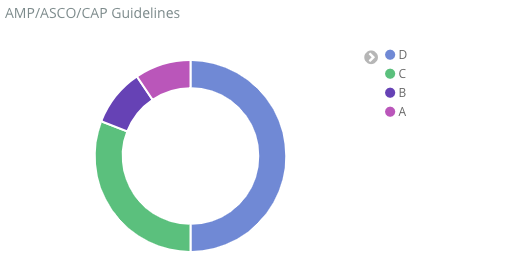
Evidence Pie
This interactive pie chart illustrates the distribution of results by normalized evidence label (levels A-D) based on the AMP/ASCO/CAP guidelines. Clicking on a segment of the pie chart will automatically create a Custom Filter for the selected element. This filter may be manually edited to include additional evidence levels.
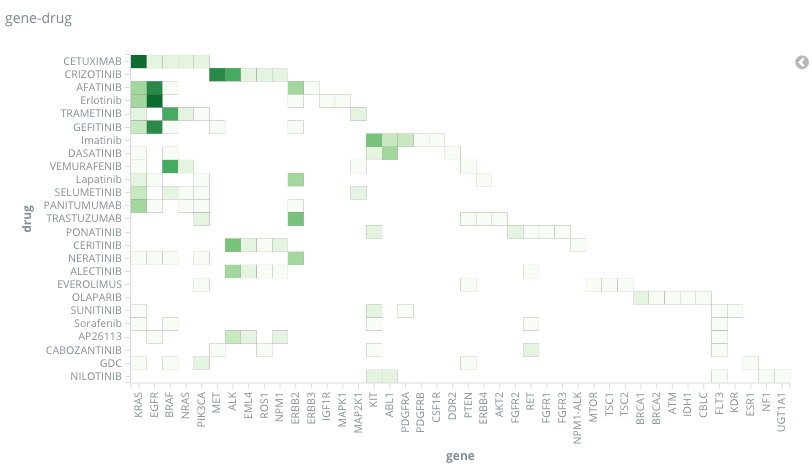
Gene/Drug Heatmap
This interactive heatmap visualizes the frequency of results describing a gene/drug pair. Clicking on a tile of the heatmap will automatically create two Custom Filters for the selected gene and drug, respectively. Each filter may be toggled and edited independently.
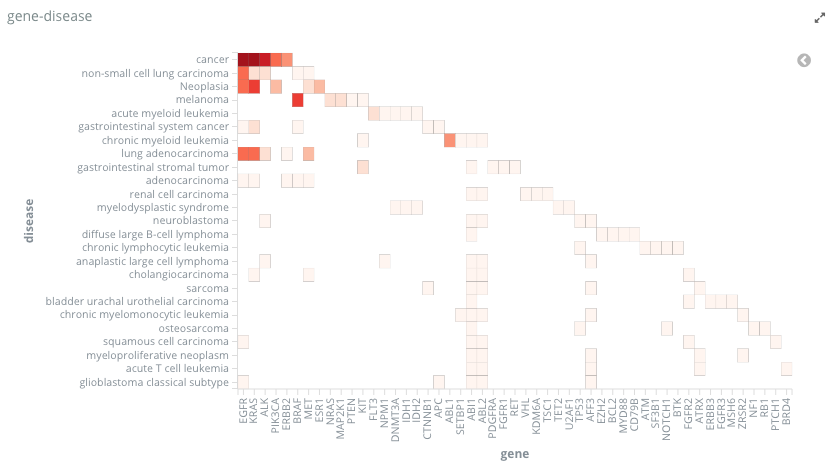
Gene/Disease Heatmap
This interactive heatmap visualizes the frequency of results describing a gene/disease pair. Clicking on a tile of the heatmap will automatically create two Custom Filters for the selected gene and drug, respectively. Each element may be toggled and edited independently.